Running a field service business on gut feel gets you to a point. It gets you your first five clients, your first technician, your first van. But somewhere between 3 technicians and 10 technicians, gut feel starts to fail. Jobs multiply, complexity increases, and the things that used to be obvious start becoming invisible.
Which technician is most profitable? Which job types lose money? Which clients take the longest to pay? Which recurring contracts are up for renewal next month?
These questions have answers, but only if your business generates data, and only if you have a dashboard that translates that data into decisions. This guide covers the five KPIs that South African field service businesses should be tracking, and how to set up a data-driven reporting system using Omni.
KPI 1: First-Time Fix Rate
First-time fix rate (FTFR) measures the percentage of jobs resolved on the first visit without requiring a return trip. It's one of the most powerful KPIs in field service because it directly correlates with customer satisfaction, technician efficiency, and operating cost.
In South Africa's field service market, an FTFR below 70% is a warning sign. Best-in-class businesses achieve 85-92%. The difference is driven by:
- Pre-job information quality (does the technician know what they're going to before they arrive?)
- Parts availability (do they have the right components on the vehicle?)
- Skills matching (was the right technician sent for the job type?)
Omni tracks FTFR automatically. When a second job is created for the same client and location within 14 days, it's flagged as a potential comeback. Your FTFR dashboard shows the rate by technician, by job type, and by location, identifying exactly where the fix failures are occurring.
KPI 2: Technician Utilisation
Technician utilisation is the ratio of billable hours to total available hours. A technician who is paid for 8 hours but only bills 5 is running at 62.5% utilisation. The remaining 2.5 hours, travel, admin, idle time, depot visits, represent overhead cost with no revenue offset.
Industry benchmarks for SA field service businesses:
- Below 65%: Significant scheduling or routing inefficiency
- 65-75%: Average, common in businesses using manual dispatch
- 75-85%: Good, typical for businesses using digital job management
- Above 85%: Excellent, typically achieved with GPS route optimisation and automated scheduling
KPI 3: Job Profitability
Revenue per job is a vanity metric. Profit per job is what matters. A R2,500 HVAC installation that took 6 hours and consumed R800 in parts is less profitable than a R1,200 electrical repair that took 90 minutes and consumed R150 in parts.
Omni calculates job profitability automatically by subtracting materials cost (from the inventory catalogue) and labour cost (from the technician's hourly rate and time on site) from the invoice total. The resulting profit margin is tracked by job type, client, and technician, showing you exactly which work deserves more of your marketing attention and which job types are worth declining or repricing.
KPI 4: Invoice-to-Payment Cycle
For SA field service businesses, the invoice-to-payment cycle is one of the most financially critical metrics. An average cycle of 45 days means R150,000 outstanding at any time for a business billing R100,000 per month. That working capital gap is often the difference between investing in growth and struggling with cash flow.
Omni's accounts dashboard shows your average cycle time, broken down by client (some clients consistently pay faster than others), by invoice size, and by payment method. This lets you make informed decisions about payment terms for new contracts and identify clients who consistently pay late for targeted follow-up or revised terms.
KPI 5: Customer Satisfaction Score
Post-job satisfaction ratings (collected automatically via Omni's feedback system) give you a real-time view of service quality at the technician level. A technician consistently rating below 3.5 stars needs intervention, training, supervision, or conversation. A technician consistently rating 4.8+ stars should be recognised and their approach studied for replication.

How to Reduce Admin Time: Automated Weekly Reports
The most common reason SA service business owners don't track KPIs is time. Building a weekly performance report from spreadsheets and banking data takes hours. Omni generates this automatically.
Configure a weekly report to be emailed to you every Monday morning containing:
- Previous week's revenue vs. target
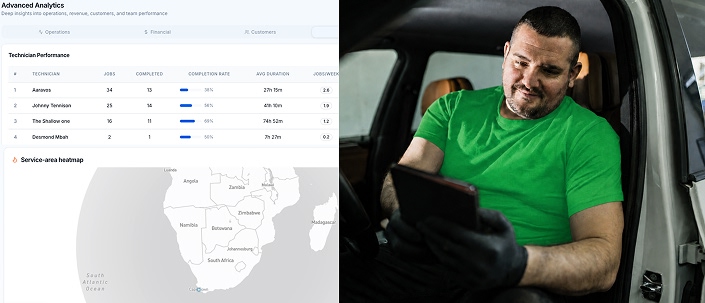
- Jobs completed by technician
- Outstanding invoices and overdue amounts
- FTFR for the week
- Average customer satisfaction rating
- Top 5 highest and lowest margin jobs
The report arrives before you open your first email of the week. You start your Monday with intelligence, not guesswork.
Get Your Business Intelligence, Free
KPI dashboards, technician performance reports, job profitability analytics, and automated weekly reports are included in every Omni plan. Start your free trial and see your first performance dashboard today.